AI is showing up in more BI tools and analytics workflows, particularly as natural language analytics. But results often fall short because LLMs don’t know your business: the metric definitions, valid join paths, and constraints buried in SQL, dashboards, wikis, and tribal knowledge. Without this context, even the best LLMs are just guessing.
A semantic data model fixes this. It puts definitions, joins, and rules in one place so both people, BI tools and AI use the same logic. When the data model is clear, a SQL query, a Looker Explore, and a natural language question return the same number.
This post distills a talk at dbt Coalesce by Select Star's Head of Data Strategy & Customer Success, Alec Bialosky, into a practical guide. We cover why the semantic data model matters, what to include and exclude, and a step-by-step process to build and validate one you can ship quickly.
What is a semantic data model and why is it important for AI
A semantic data model is a blueprint that encodes your business definitions (metrics, dimensions, entities) and the allowed relationships, in a form both BI tools and LLMs can interpret. With that context in place, AI becomes useful for analytics in four concrete ways:
- Shared meaning for machines. Business definitions for metrics, dimensions, and relationships are encoded in the semantic data model so AI can interpret them the same way your team does.
- Query correctness. The semantic data model provides the schema, valid joins, and relationships so LLMs generate accurate SQL rather than hallucinations.
- Context for reasoning. With metrics, hierarchies, and relationships encoded, AI can explain why results look the way they do, not just return numbers.
- Foundation for automation. The model lets AI build, test, and refine analytics workflows without reinventing metric logic each time.
What to include in your semantic data models
A useful semantic data model is intentionally streamlined. Start with the parts that help people and AI ask and answer business questions: clear definitions, safe joins, and the calculations teams rely on. Keep pipeline and staging details in code, not in the model. As adoption grows, you can add breadth, but begin with the minimum that unlocks trusted answers.
Include
- Entities and dimensions. The core things you analyze, the grain for each, and the attributes you slice by. Examples: customer, order, product, date, region.
- Metric calculations. Canonical formulas for KPIs and derived measures. Capture filters, windowing, and null handling.
- Relationships. Allowed join paths with the expected cardinality. Make the safe path the default and call out disallowed shortcuts.
- Business rules and language. Synonyms, common phrases, and examples that map to model elements. This helps both humans and AI route questions correctly.
Exclude
- Raw or staging tables. Keep the model at the reporting layer. If a field is not used for analysis, it does not belong here.
- ETL and pipeline details. Transform steps and implementation details live in your code, not in the model. One‑off or experimental metrics. If it is not standardized and broadly useful, keep it out until it is.
How to build a semantic data model
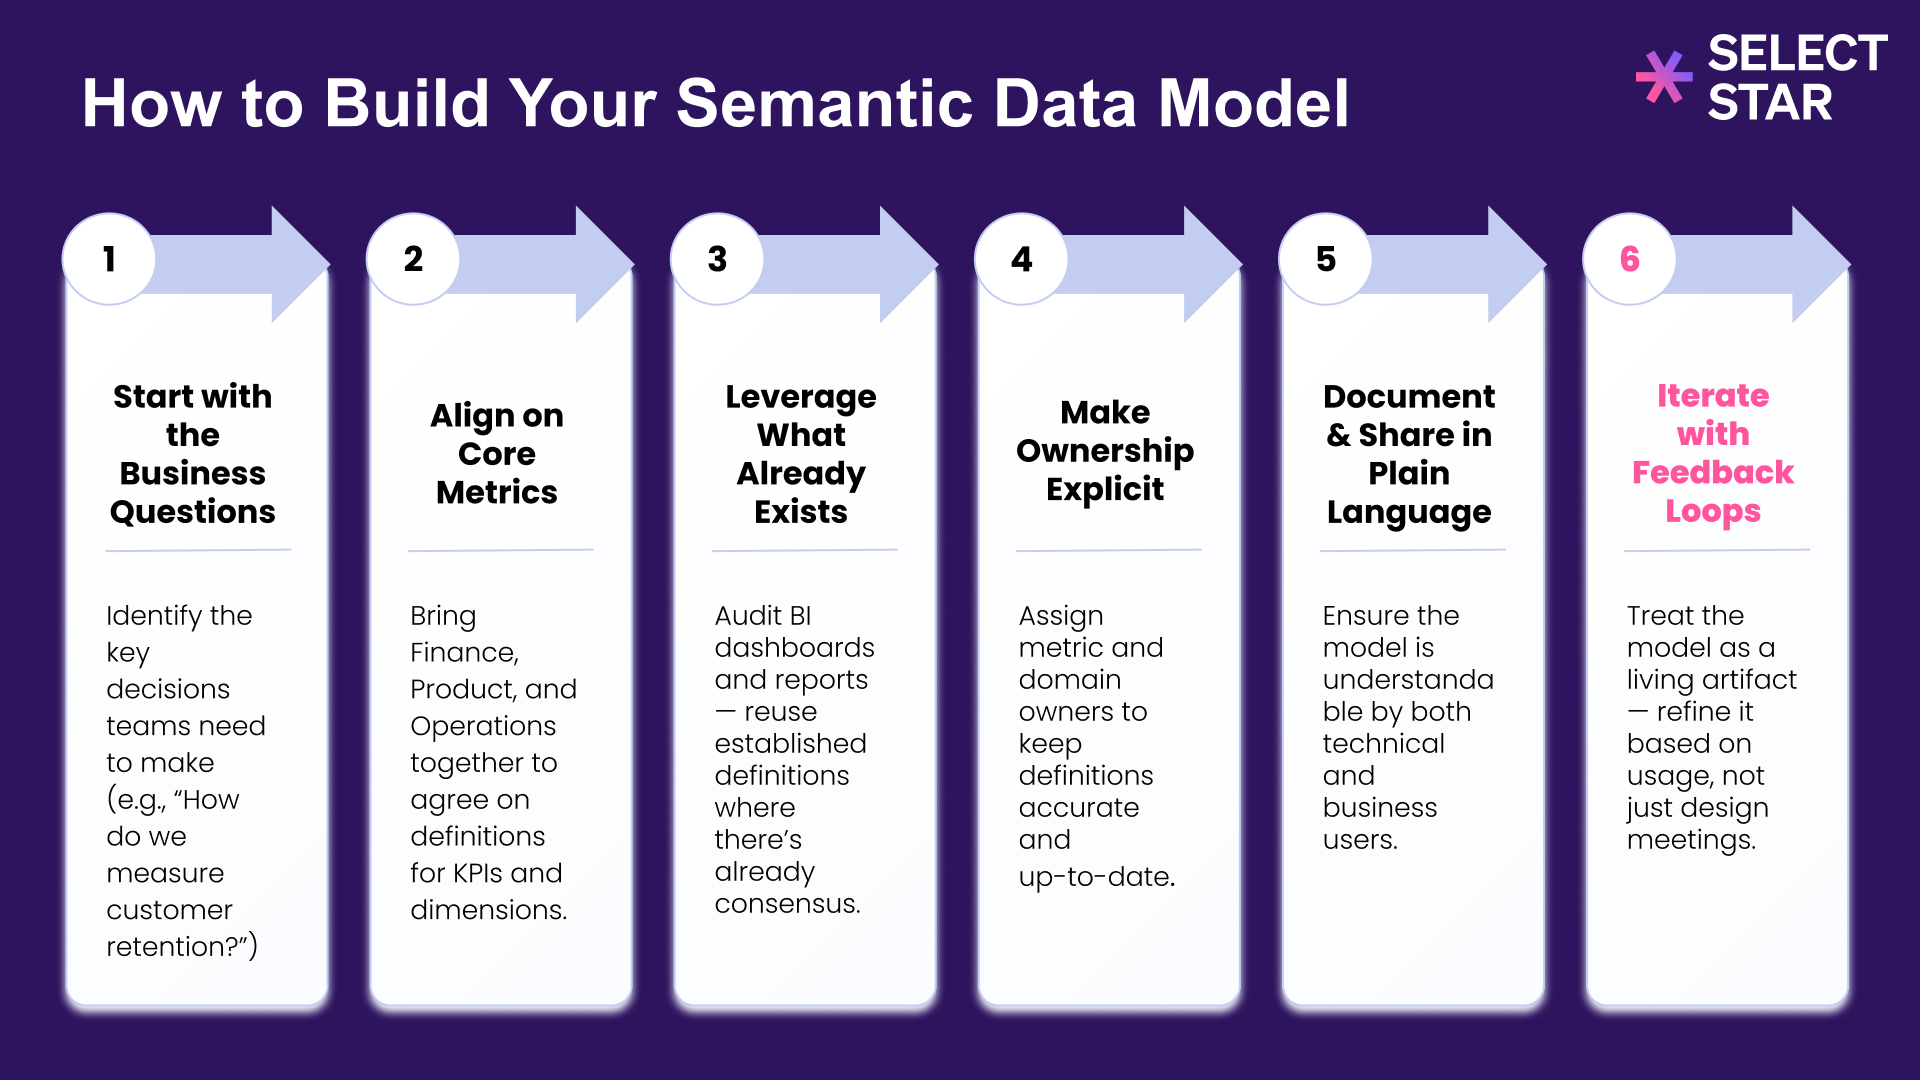
To build a semantic data model your BI and AI can trust, follow these six steps. Start with the questions your business asks most often, align on canonical metrics, reuse trusted assets, make ownership explicit, document in plain language, then iterate with feedback.
1) Start with the Business Questions
Identify the decisions teams make and the questions they ask most. Group by theme. For each theme, list the entities involved, key slices (time, region, segment), and the primary KPI. This gives you the first pass at entities, dimensions, and metrics.
Examples to seed your list:
- What was revenue last quarter by region and segment?
- How many active customers churned within 30 days of their first order?
- Which products drive repeat purchases in the first 90 days?
2) Align on Core Metrics
Bring Finance, Product, and Operations together. Agree on canonical formulas and grains. If two versions are required, define both and document when to use each.
Document each KPI in plain language so anyone can reproduce the number:
- Business definition and reporting grain
- Formula (include key filters)
- Owner
- Last updated
3) Leverage What Already Exists
Do not reinvent definitions if trusted dashboards already exist. Audit the reports leaders rely on and lift formulas, filters, and join paths directly. This shortens time to value and provides an answer key for validation.
4) Make Ownership Explicit
Assign domain owners and metric owners. Capture a lightweight change log so downstream users can see what changed and why. Define a simple process for proposing new metrics and retiring unused ones.
Ownership checklist:
- Named owners per entity and metric
- Changelog with date, change summary, and approver
- Review cadence to reconcile BI vs model differences
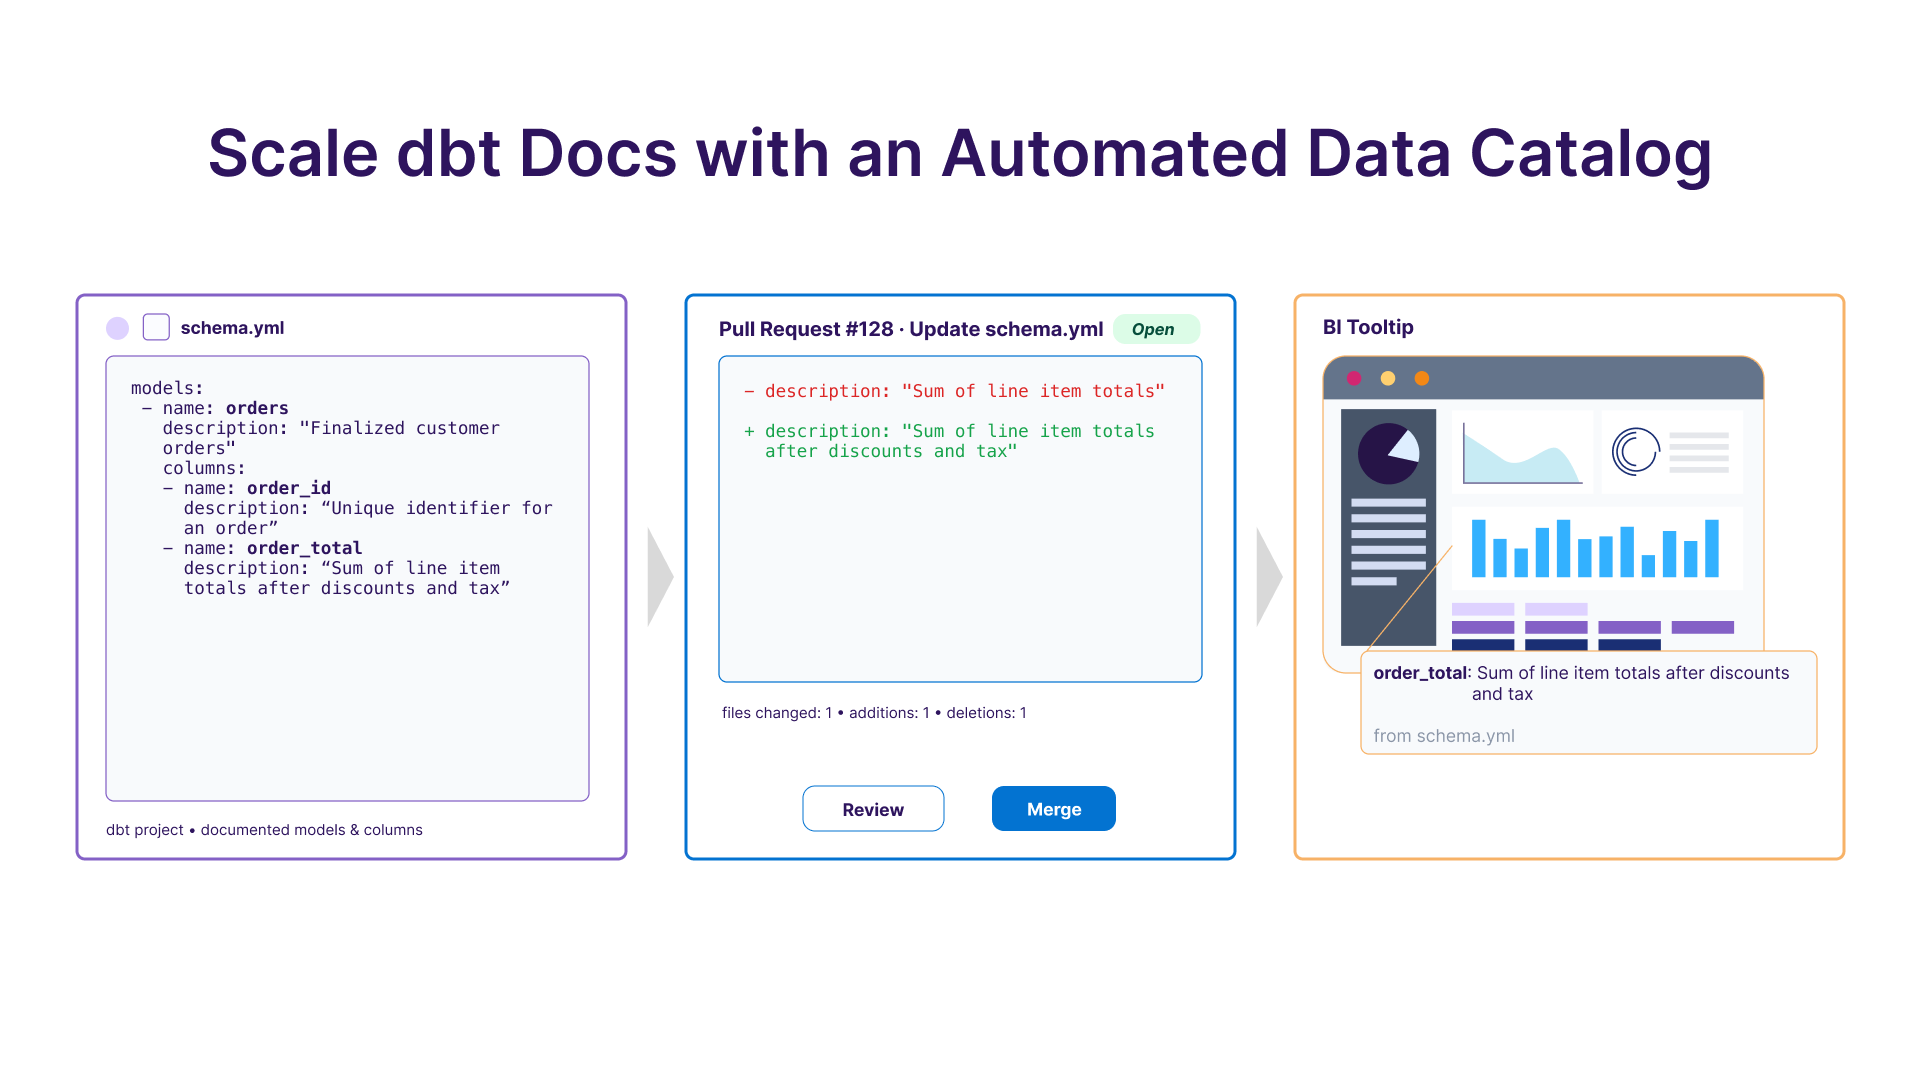
5) Document and Share in Plain Language
Write descriptions that nontechnical stakeholders can understand. Add synonyms for key terms, sample values, and example questions. Spell out safe join paths and expected cardinality. Publish the docs where people already work and make them searchable.
What to publish and share:
- Plain‑English definition and formula
- Synonyms and common phrases (for AI routing)
- Example questions mapped to metrics
- Diagram of allowed joins between core entities
6) Iterate with Feedback Loops
Treat the model as a living asset. Validate early and often, then improve based on real usage rather than long design meetings.
How to validate and gather feedback:
- Parity with BI: compare LLM answers to canonical dashboards for 10 high‑value questions
- Consistency checks: same question across tools should match, even with varied phrasing
- Usage‑based tests: prioritize questions people ask most
- Drift monitoring: alert when model outputs diverge from BI or when upstream assets change
Automating semantic data model generation with Select Star
If you already have dashboards that leaders trust, you can bootstrap the model by extracting the formulas and relationships that power those dashboards. Many teams find that this flips the effort profile from mostly building to mostly testing, which speeds up rollout and improves reliability.
Select Star can help automate semantic model generation. We can reverse engineer metric logic, joins, and entities from BI tools and warehouse lineage, then output a clean YAML model with entities, dimensions, relationships, metrics, synonyms, and sample values. We keep the model lean by importing only fields that are actually used. You can publish to the dbt Semantic Layer or your warehouse, and make the model available to AI tools. We also track dependencies and changes, and surface drift when source assets move.
Want to add guide rails to your AI tools? Connect with our team to see semantic model generation in action.