Effective data governance is foundational to managing growing data complexity, ensuring regulatory compliance, and enabling data-driven decision-making across the enterprise. Yet, for all its strategic importance, measuring the success and ROI of data governance remains a persistent challenge for data leaders. Unlike more transactional initiatives, data governance programs often operate as enabling functions. They produce outcomes that are indirect, interdependent, and long-term.
In this post, we’ll explore why measuring data governance success is difficult, the different types of metrics that can help quantify its impact, and how to articulate the return on investment (ROI) in business-relevant terms. Our goal is to help data leaders establish credible, outcome-focused governance metrics and KPIs that resonate with both technical teams and executive stakeholders.
Table of Contents
- Challenge of Measuring Data Governance ROI
- Data Governance Metrics and KPIs by Function
- The ROI of Data Governance for Business Stakeholders
- Best Practices for Establishing Data Governance Metrics and KPIs
- Translating Data Governance Metrics and KPIs into Business Impact
Challenge of Measuring Data Governance ROI
The difficulty in measuring data governance success stems from its inherently cross-functional nature. Unlike operational processes that produce direct outputs, such as page load speed for engineering or conversion rate for marketing, data governance practices work behind the scenes to improve data quality, consistency, and accountability across business domains.
Many governance outcomes manifest as risk reduction, process improvement, or improved trust in data, which are not always immediately measurable or attributable to a single intervention. Additionally, these outcomes often depend on a combination of technology, people, and process changes, making attribution complex.
For example, establishing standardized definitions for customer attributes might reduce reporting discrepancies over time, but quantifying that improvement and tying it directly to the governance initiative requires detailed usage analytics, baseline comparisons, and stakeholder interviews.
Moreover, different stakeholders define success differently. For data stewards, success might mean increased adoption of certified datasets. For compliance officers, it could mean fewer audit findings. For executives, it's about faster and more confident decision-making. These divergent expectations necessitate a broad yet targeted framework of metrics.
Data Governance Metrics and KPIs by Function

To bring structure to this complexity, it helps to categorize data governance metrics into functional groups. First, it’s important to distinguish between metrics and KPIs:
- Data governance metrics are specific measurements used to monitor individual aspects of the governance program. They provide granular, operational data that can help teams identify trends, assess process performance, and uncover areas needing improvement.
- Data governance KPIs (Key Performance Indicators) are strategic indicators that track progress toward defined governance objectives. KPIs often aggregate multiple metrics and are used to communicate success to stakeholders in a business-relevant way.
The most effective and successful data governance programs define metrics across four key dimensions: data quality, policy compliance, data usage, and operational efficiency.
1. Data Quality & Trust Metrics
High-quality data is a direct outcome of robust governance. Metrics in this category focus on accuracy, completeness, consistency, timeliness, and uniqueness of data. These are often monitored using automated data quality tools and business rules.
For instance, a company might measure the percentage of product records missing key attributes like category or price. A reduction in missing values after a governance intervention, such as standardized input validation or stewardship workflows, can be a concrete indicator of success.
Example data governance metrics for data quality & trust:
- % of tables with descriptions, owners, or lineage.
- # of data quality incidents per month or quarter.
- Frequency of duplicate or conflicting datasets being used in dashboards.
2. Compliance & Risk Management Metrics
Governance is critical for meeting regulatory requirements such as GDPR, HIPAA, or CCPA. Metrics in this dimension evaluate adherence to policies around data retention, access control, and classification.
One example is tracking the percentage of sensitive datasets that are properly tagged and access-restricted according to policy. An increase in policy-compliant datasets over time signals maturing governance.
Another common metric is the number of policy exceptions or audit findings per quarter. A downward trend suggests improved compliance and lower risk exposure.
Example data governance metrics for compliance & risk management:
- % of sensitive datasets with access controls in place.
- Audit trail completeness: Can you track who accessed what and when?
- Mean time to revoke access post-offboarding.
3. Data Usage and Adoption Metrics
If governance efforts are successful, they should increase the discoverability, trust, and usage of governed data assets. Metrics in this category evaluate whether governed assets are actually being used in practice.
Key indicators include the number of certified datasets accessed by business teams, or the volume of queries run on curated data sources compared to raw or legacy datasets. An upward trend can signal growing trust in governed assets.
Tools like Select Star allow teams to track usage metrics and determine whether certified data sources are gaining traction.
Example data governance metrics for data usage & adoption:
- Active users of the data catalog.
- Glossary term or data documentation contributions per quarter.
- # of certified or endorsed datasets vs. total datasets.
4. Operational Efficiency Metrics
Governance can also streamline data operations by reducing duplicative work, accelerating onboarding, and clarifying ownership. Metrics here are more internally focused but just as critical.
One metric is the time to resolve a data issue from discovery to resolution. Governance processes that clearly define data owners and escalation paths can shorten this lifecycle significantly.
Another is the time required to onboard a new analyst or data consumer. With centralized documentation and data lineage, onboarding time should decrease, reflecting increased data accessibility and reduced friction.
Example data governance metrics for operational efficiency:
- Average time from issue identification to full resolution.
- Time to approve data access requests.
- Time to onboard new data users.
The ROI of Data Governance for Business Stakeholders
Translating governance outcomes into business value is essential for maintaining executive support. This requires reframing metrics in terms of risk avoided, efficiency gained, or revenue enabled.
Cost Reduction from Improved Data Quality
Gartner estimates that poor data quality costs organizations an average of $12.9 million annually. Framing governance in terms of reduced data rework, fewer reporting errors, or faster resolution of data issues makes its value tangible.
For instance, a 30% reduction in incidents caused by incorrect customer data might translate into thousands of dollars saved in customer support hours and churn prevention.
Compliance Cost Savings and Risk Mitigation
Compliance is a non-negotiable requirement for many industries, but the cost of audits and investigations can be significant. A well-governed data environment reduces the effort required to respond to regulatory scrutiny by ensuring data is classified, access is tracked, and lineage is fully visible.
Data leaders can frame governance ROI in terms of audit readiness. For example, if responding to data subject access requests under GDPR takes days instead of weeks due to proper tagging and ownership tracking, the savings in both labor and risk exposure are concrete.
Decision-Making Acceleration Through Trusted Data
Improved availability and trust in data enable faster, more confident business decisions. While this benefit can be difficult to quantify precisely, it directly affects business agility and productivity.

If analysts spend less time validating data and more time generating insights, the cumulative time savings can be substantial. For example, a case study at Xometry demonstrated how implementing column-level data lineage reduced the time needed for root cause analysis from days to hours, helping the team eliminate recurring data outages and freeing up time for more strategic work.
Collaboration Improvements Across Data Stakeholders
Governance clarifies ownership, standardizes definitions, and reduces ambiguity between producers and consumers of data. This enhances coordination and minimizes misalignment in reporting or analytics.
Over time, better collaboration leads to fewer redundant dashboards, clearer KPIs, and improved trust across departments. These outcomes are essential for maintaining consistency in executive reporting and data-driven planning.
Best Practices for Establishing Data Governance Metrics and KPIs
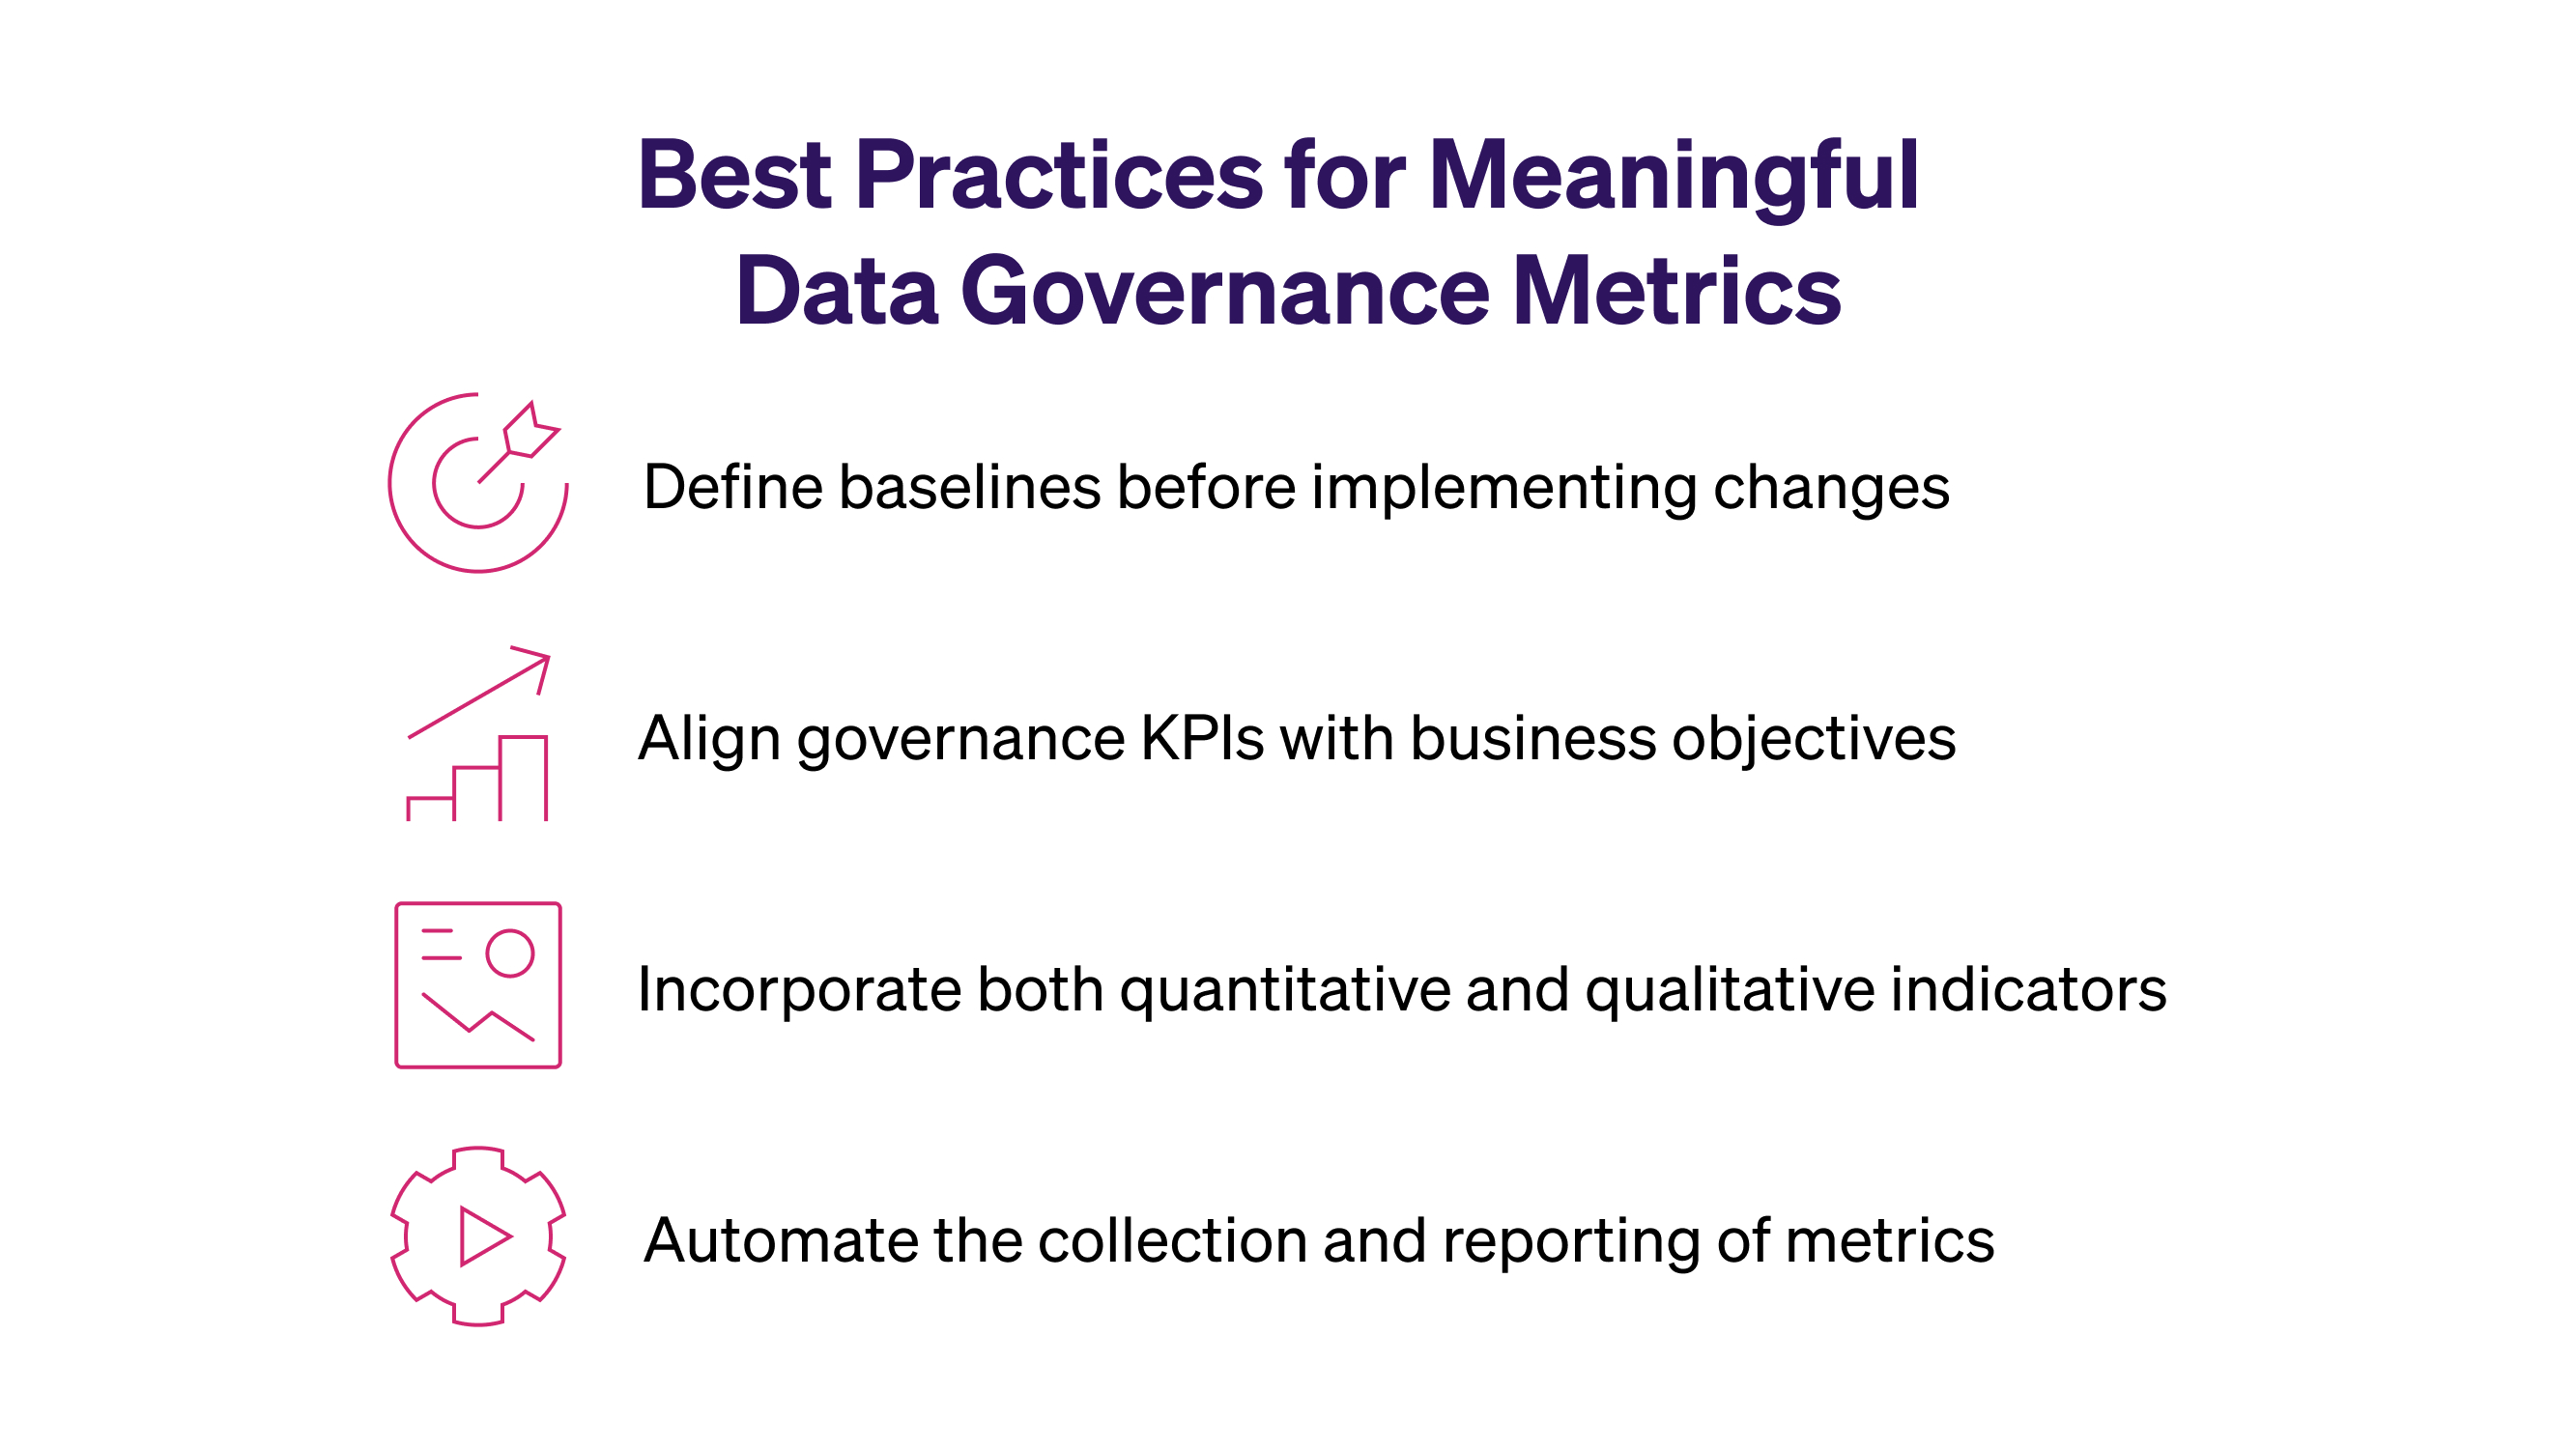
Successful measurement of data governance relies not just on what is measured, but how metrics are integrated into ongoing processes. Here are four best practices for establishing meaningful governance metrics.
- Define baselines before implementing changes.
Data governance metrics are only valuable when improvement can be demonstrated over time. This requires capturing initial benchmarks for key indicators such as data quality scores, incident rates, access control violations, and dataset usage. Without these baseline metrics, it's impossible to establish whether a governance initiative has made a measurable difference or simply coincided with other changes in the environment. - Align governance KPIs with business objectives.
Data governance KPIs must reflect outcomes that resonate with executive stakeholders. That means linking governance activities to business drivers such as operational efficiency, customer satisfaction, regulatory compliance, or improved decision-making speed. When KPIs clearly map to strategic goals, they are more likely to receive ongoing investment and attention from senior leadership. - Incorporate both quantitative and qualitative indicators.
While quantitative measures such as reduction in data quality incidents or increased dataset usage are essential, qualitative feedback also provides critical context. For example, conducting periodic surveys to assess stakeholder trust in data or perceived ease of data discovery can validate whether governance efforts are actually improving the data experience. Combining both forms of evidence strengthens the credibility of success claims. - Automate the collection and reporting of metrics.
Relying on manual methods to track governance outcomes is inefficient and often leads to incomplete or inaccurate data. Instead, integrate automated monitoring into your data infrastructure. Tools that support continuous data quality checks, access audits, lineage tracking, and dataset usage statistics like Select Star can provide up-to-date insights. Automation not only reduces the burden on governance teams but also enables continuous improvement through timely feedback loops.
Translating Data Governance Metrics and KPIs into Business Impact
Measuring the success of data governance is inherently challenging, but not impossible. By categorizing metrics across data quality, policy compliance, usage, and operational efficiency, data leaders can create a balanced scorecard that reflects both technical progress and business impact.
Equally important is the ability to communicate these metrics in terms of ROI, whether through cost savings, risk reduction, or improved agility. Framing governance as an enabler of trusted, efficient, and compliant data usage helps elevate it from a technical function to a strategic asset.
To support these efforts, visual aids such as dashboard usage heatmaps, and compliance audit summaries can provide compelling, evidence-backed narratives. Placing these visuals alongside governance metrics in executive briefings ensures data governance maintains visibility and investment at the highest levels.
In the end, governance should be measured not only by what it controls, but by how clearly it empowers the business to move forward with confidence.